


How To Reframe A Business Question As A Causal Question Part 1

Causal inference is a core concept in data science and data engineering that is widely misunderstood and misused. This results in one of the field’s biggest problems: overextending and overstating model reliability. Generative AI has brought reliability into the spotlight, but simpler models have the same challenges.
Before introducing knowledge graphs in my third post on marketing and explaining applied innovation in another article, I must explain causal relationships, how we discover them, and how we validate or refute them. Learning data science always starts with learning science; the same is true when putting it into practice.
In a business context, we don’t need academic reliability to deploy a model to production. A model that adds to the body of knowledge differs significantly from one that adds business value. Causal inference’s foundational principles apply in business because we must still understand our assumptions. Put differently, we get to cut corners, but we must understand the corners we cut to make decisions informed by risks and supported by mitigations.
What Is Causality, And Why Do You Care?
Causality is the relationship between a cause and an effect. EILI5: A cause makes something else happen or exist; an effect is what happens or exists because of the cause. For example, if you turn on a light switch (the cause), the light bulb will light up (the effect).
If you consider electricity’s role, you see the complexity involved in causal systems. Data engineers often gather data about the most apparent relationships, in this case, between the light switch and light bulb states. Electricity is one unobserved and ungathered variable in the system.
The model will fail if the power goes out or something else takes electricity out of the system. Outliers (the bulb burns out or the circuit connecting the switch to the light bulb fails) also impact model reliability. We gather data about the well-understood parts of the system, and many data scientists and engineers end their exploration there. Thinking in causal terms changes that.
Data scientists work with two types of models. In most cases, our work results in data models that describe the shape of the training data. We don’t think about shape enough. Datasets have surfaces and form in n-dimensional space. It’s typically hidden by our usage of matrices for most machine learning and deep learning tasks.
We mentally model datasets as n-cubes, but that’s not their true shape. The nature of the connections between data points in the dataset defines the number of dimensions (geometric space) and shape. SQL queries to deep learning models describe data and may contain some information about the relationships.
Expert heuristics define features and relationships in SQL queries. People imply relationships by delivering the data together in a single result set or aggregating values to create new data points. Our expert knowledge is the validation method. Math and architecture propose features and relationships in models. Testing validates that they match the shape of the training data.
The model data architects choose to hold all the data is optimized for its shape and the most queried or requested regions. For people-driven queries, the relational database or document JSON models work best. We need a different structure to optimize data serving for model training (no heuristic) vs. human consumption (expert heuristics). Models must reconstruct the shape of the training data. The ideal data architecture contains the data and as much information about the relationships as possible.
Here's where we transition to the second type of model and why you care about causal methods. Systems models describe the shape of the workflow, process, entity, etc., that generates the data. These models act like the system and represent the system’s state or change in state based on inputs and conditions.
Systems models change data architecture and engineering. In data modeling, data is the first-class citizen, while in systems modeling, the system takes that place. The model holding the data optimizes for the system’s shape. The rules or functions that explain how the system works define the relationships between variables or data points and outcomes. Complex systems are often governed by nonlinear functions, so the linear document and relational DB structures aren’t ideal.
As our need for model accuracy increases, we must transition from data models to systems models. Businesses mature from asking “What has happened?” to asking “Why did that happen? What will happen? What are the consequences of taking specific action?”
In systems modeling, we are concerned with identifying the data produced by the system and the functions that govern it. Causal methods support the change from data models to systems models and, as I will discuss further in the next post, the change from traditional data models to graphs.
Causal methods attempt to learn about systems by addressing the direct effect of an intervention on the outcome or how a specific action or change (an intervention) influences the result or end state (the outcome). An intervention can be anything that alters the existing conditions or circumstances, such as a treatment, a policy, a program, or an experiment. An outcome can be anything measured or observed after the intervention, such as behavior, performance, health status, or satisfaction level.
Not All Experiments Are Designed The Same
Suppose you want to know if drinking coffee (the intervention) improves your code quality (the outcome). You can use descriptive causal methods to examine the direct effect of drinking coffee on your code quality by comparing some quality metrics before and after drinking coffee. That sounds like a rigorous experiment, but it isn’t for the same reason that the light bulb system wasn’t well defined.
The experiment’s design must control for other factors that might affect your code quality, such as your sleep quality, knowledge of the language, code complexity, or even mood. That’s why I called the causal methods descriptive. It’s an intuitive approach to understanding the basic concept of acting and measuring impacts. Descriptive causal methods are powerful teaching tools but shouldn’t be misrepresented as more rigorous methods.
Suppose your code quality is significantly higher after drinking coffee than before. In that case, you can infer a relationship between drinking coffee and improving your test scores.
Suppose your code quality is no different or lower after drinking coffee. In that case, you can infer that there is no relationship or a negative relationship between drinking coffee and improving your test scores.
We can’t claim that it’s the only variable impacting code quality. We also don’t know the weight of coffee’s impact on code quality relative to other variables. We don’t know if the relationship generalizes to most people or is localized to you.
The experiment generates high-quality data about a hypothetical relationship but doesn’t represent strong evidence for it. In academia, this would be grounds to throw the results out. In business, that’s not necessarily true. We have reason to believe there’s a relationship and some evidence to support it. This is the best available data if the business needs to decide about encouraging vs. discouraging coffee consumption for software engineers.
Differentiating Between Well-Defined And Abstract Systems
The light bulb is an example of a well-defined system. Most systems in the engineering world fall into this category. If we define the circuit, we define the system.
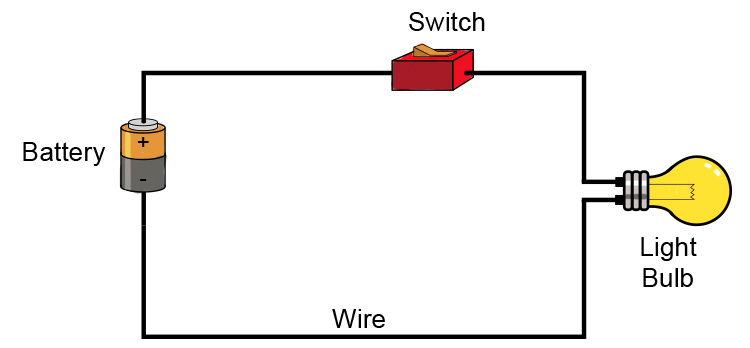
It may not look like it, but this is a descriptive causal diagram. It needs a few details filled in to be useful. The variables or concepts are the battery, switch, wire, and light bulb. The switch has two properties: open and closed. The bulb has two states: on and off. Each component has two additional properties: functional and broken.